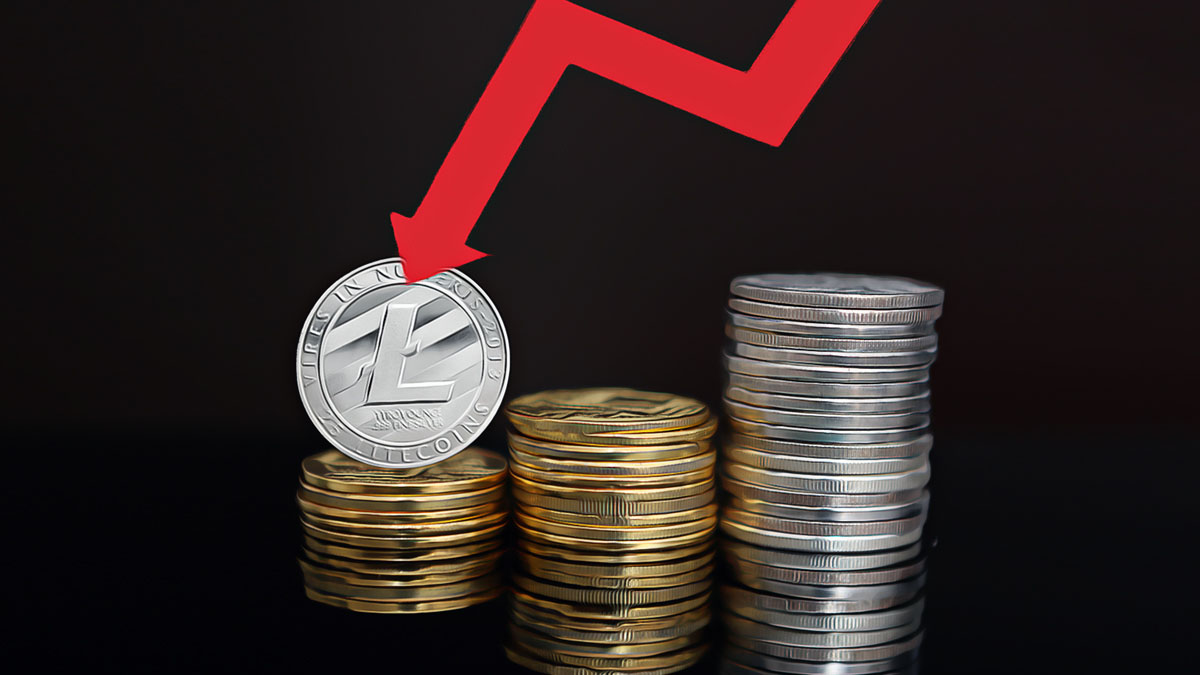
Litecoin (LTC) has been trading above a long-term support trend line for 600 days, though it failed to reclaim its previous level after a recent rise from a minor support level. Technical analysis on a weekly timeframe reveals that LTC’s price has been increasing alongside an ascending support trend line, which has been validated multiple times, including this week. Despite a short-lived rise in August 2023, LTC’s price fell back near the support trend line.
The Litecoin team announced the expansion of the institutional exchange EDX, backed by some of the biggest names in finance, into Asia. EDX will support transactions in Bitcoin (BTC), Ethereum (ETH), and Litecoin (LTC). The weekly Relative Strength Index (RSI), a momentum indicator used to evaluate overbought or oversold conditions, is showing a downward trend.
Readings above 50 on the RSI suggest that bulls still have the advantage, while readings below 50 indicate the opposite. Currently, the RSI is below 50 and falling, which could signal a potential decline. A six-hour technical analysis suggests a higher likelihood of LTC breaking from its long-term support level, influenced by price action and RSI trends.
Price movement indicates that LTC has been falling below a decreasing resistance trend line since December 2023, with the latest rejection on January 12 leading to a break from a $68 horizontal area. Additionally, a divergence from the previous uptrend trend line in the six-hour RSI could indicate bearish signs. If LTC’s price falls below $63.50, it could drop by 8% to the next closest support at $60.50.


